UpValUpVal
Sign inTry for free
The engine

The engine behind every number.

Every figure UpVal prints comes out of one engine. It measures what it can, prices the work against sourced local rates, and says how much of the answer it actually measured.

BuildingRatesUpliftCostingEngine
Start a project
B.R.Building Rates
Building Rates · 1 of 2

A rate is a row, not a number.

BRUCE does not hold one price for tiling. He holds a band for tiling, in your council, for this month, derived from named public sources.

Building Rates · 2 of 2

Judgement gets a vote, not a veto.

Every rate the model proposes is checked against the sourced band for that trade in that council. If it falls outside, the band wins. The number is replaced.

Every month is kept rather than overwritten, so any report can be rerun against the rates of its day.

Tiling

Lane Cove · September 2026 · labour
$71 – $114 /hr
Sourced band3 sources
trade_rates one row · eight fields
tradeTiling
item_ref15.1
unit
labour low71.00
labour high114.00
lga_index1.039
period2026-09
sources3
tradeThe trade the row prices.
item_refThe scope line it attaches to.
unitHow the quantity is measured.
labour lowBottom of the sourced band, $/hr.
labour highTop of the sourced band, $/hr.
lga_indexCouncil adjustment to the Sydney base.
periodThe month the band was derived.
sourcesNamed public sources behind it.
What looks like one number is eight things that can each be checked.
The model proposed $127. The band tops out at $114.
$71$114
Proposed $127
Rate clamp labour $/hr · Tiling · Lane Cove · 2026-09
Proposed127.00 outside band
Sourced band71.00 – 114.00
Difference+13.00
Applied114.00 ceiling wins
Flag raisedNone. Value replaced.
Where a trade has no sourced row, the line says estimated rather than benchmarked.
Building Rates · 1 of 2

A rate is a row, not a number.

BRUCE does not hold one price for tiling. He holds a band for tiling, in your council, for this month, derived from named public sources.

Tiling

Lane Cove · September 2026 · labour
$71 – $114 /hr
Sourced band3 sources
trade_rates one row · eight fields
tradeTiling
item_ref15.1
unit
labour low71.00
labour high114.00
lga_index1.039
period2026-09
sources3
tradeThe trade the row prices.
item_refThe scope line it attaches to.
unitHow the quantity is measured.
labour lowBottom of the sourced band, $/hr.
labour highTop of the sourced band, $/hr.
lga_indexCouncil adjustment to the Sydney base.
periodThe month the band was derived.
sourcesNamed public sources behind it.
What looks like one number is eight things that can each be checked.
Building Rates · 2 of 2

Judgement gets a vote, not a veto.

Every rate the model proposes is checked against the sourced band for that trade in that council. If it falls outside, the band wins. The number is replaced.

Every month is kept rather than overwritten, so any report can be rerun against the rates of its day.

The model proposed $127. The band tops out at $114.
$71$114
Proposed $127
Rate clamp labour $/hr · Tiling · Lane Cove · 2026-09
Proposed127.00 outside band
Sourced band71.00 – 114.00
Difference+13.00
Applied114.00 ceiling wins
Flag raisedNone. Value replaced.
Where a trade has no sourced row, the line says estimated rather than benchmarked.
U.Uplift
Uplift · 1 of 3

What it costs is half the question.

Cost tells you what you will spend. Uplift tells you what the market is likely to return for it, at this address, at this level of finish. BRUCE models both, because the decision is the difference.

Uplift · 2 of 3

It starts from the house as it is.

A kitchen replaced two years ago is not the same starting point as one from the 1960s. BRUCE checks whether each image still represents the property, and the report names the ones he trusted.

Uplift · 3 of 3

An extension that cannot be approved adds nothing.

The uplift model is capped by what the controls at your address permit. What you may build governs what it can be worth, so both are answered together.

1.6×return on spend
You spend$225.3k – $245.8k
It is worth$353k – $401k
Kitchen and dining renovation both sides of the decision

Cost$225.3k – $245.8k

Measured quantities, benchmarked rates for September 2026, GST inclusive.

Uplift$353k – $401k

Modelled from local sales, from the house as it is, capped by the controls at the address.

Net position$107.2k – $175.7k

Worth low less cost high, to worth high less cost low.

Multiplier1.6×

Midpoint of worth over midpoint of cost.
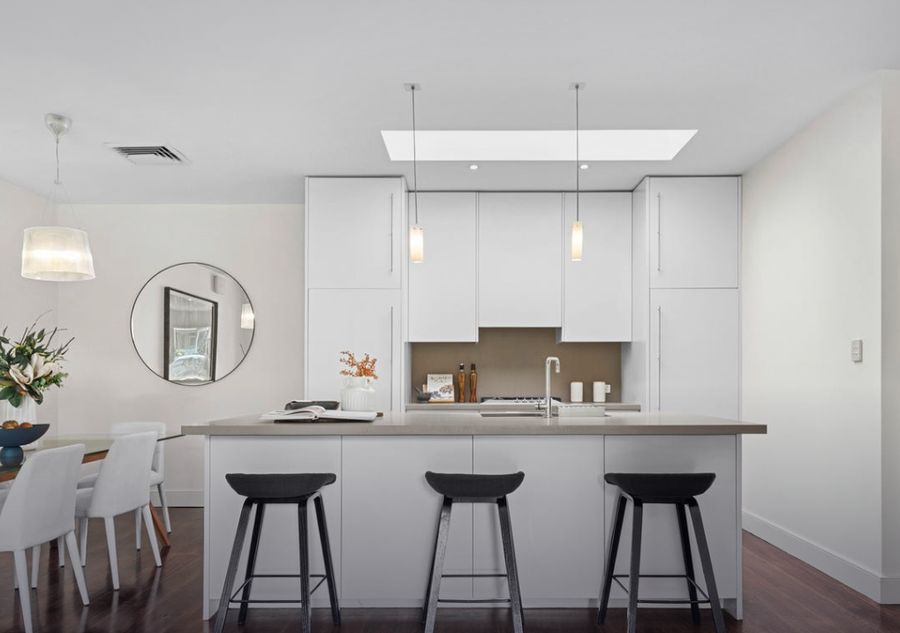
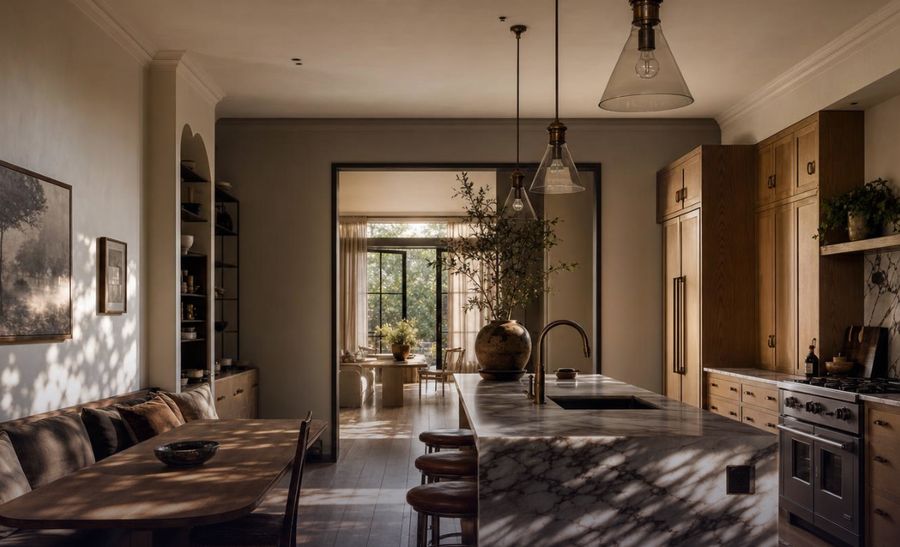
Current kitchen, owner photo
img_03 · CurrentCaptured July 2026 · owner uploadFixtures match img_02 layoutUsed for condition and layout
Kitchen from an older listing
img_02 · SupersededCaptured March 2024 · listingFixtures differ from img_03Not used
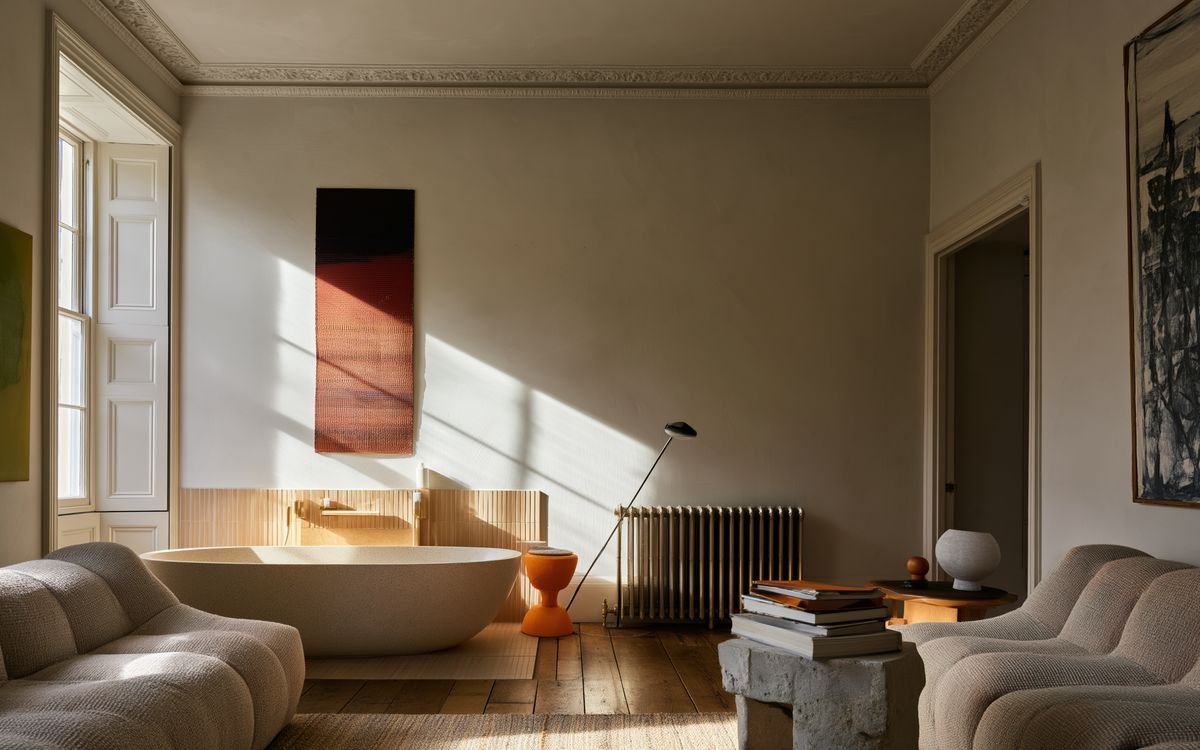
Living room from a listing archive
img_01 · UndatedListing archive · no capture dateNo EXIF, no listing dateUsed for layout only
Value, with and without the rear extension
Renovation as scopedRear extension
Counted in the upliftPending the controls
Planning ceiling 42 Brushbox Crescent, Lane Cove
Height of buildingsScope 7.9 m · control 8.5 mWithin
Floor space ratioScope 0.58:1 · control 0.5:1Exceeds
Rear setbackScope 8.4 m · control 8 mWithin
Landscaped areaScope 38% · control 35%Within
The extension exceeds the floor space ratio, so its value is left out of the uplift and the report says why.
Uplift · 1 of 3

What it costs is half the question.

Cost tells you what you will spend. Uplift tells you what the market is likely to return for it, at this address, at this level of finish. BRUCE models both, because the decision is the difference.

1.6×return on spend
You spend$225.3k – $245.8k
It is worth$353k – $401k
Kitchen and dining renovation both sides of the decision

Cost$225.3k – $245.8k

Measured quantities, benchmarked rates for September 2026, GST inclusive.

Uplift$353k – $401k

Modelled from local sales, from the house as it is, capped by the controls at the address.

Net position$107.2k – $175.7k

Worth low less cost high, to worth high less cost low.

Multiplier1.6×

Midpoint of worth over midpoint of cost.
Uplift · 2 of 3

It starts from the house as it is.

A kitchen replaced two years ago is not the same starting point as one from the 1960s. BRUCE checks whether each image still represents the property, and the report names the ones he trusted.

Current kitchen, owner photo
img_03 · CurrentCaptured July 2026 · owner uploadFixtures match img_02 layoutUsed for condition and layout
Kitchen from an older listing
img_02 · SupersededCaptured March 2024 · listingFixtures differ from img_03Not used
Living room from a listing archive
img_01 · UndatedListing archive · no capture dateNo EXIF, no listing dateUsed for layout only
Uplift · 3 of 3

An extension that cannot be approved adds nothing.

The uplift model is capped by what the controls at your address permit. What you may build governs what it can be worth, so both are answered together.

Value, with and without the rear extension
Renovation as scopedRear extension
Counted in the upliftPending the controls
Planning ceiling 42 Brushbox Crescent, Lane Cove
Height of buildingsScope 7.9 m · control 8.5 mWithin
Floor space ratioScope 0.58:1 · control 0.5:1Exceeds
Rear setbackScope 8.4 m · control 8 mWithin
Landscaped areaScope 38% · control 35%Within
The extension exceeds the floor space ratio, so its value is left out of the uplift and the report says why.
C.Costing
Costing · 1 of 2

Taken off the drawing, not guessed.

The difference between an estimate and a takeoff is measurement. BRUCE reads the document set and prices against quantities he derived, not quantities he assumed.

Anything that could not be measured is labelled and carries an allowance instead.

Costing · 2 of 2

The model measures. The code decides.

Every sum, cap and total is computed the same way, in the same order, every time. Two runs of the same project produce the same number.

Provisional sums sit beneath the headline with their trigger. They are never folded in.

A-2011:50
15.1Wall and floor tiling, wet areasmeasured
14.1Waterproofing, floor and upstandsmeasured
10.11Hang doorsmeasured
12.1Wall sheetingderived
21.1Patch, prepare, paintderived
Takeoff bathroom and laundry · document set
RefItemQtyBasisSheetRange
15.1Wall and floor tiling, wet areas31 m²measuredA-201$6.8k – $11.4k
14.1Waterproofing, floor and upstands9 m²measuredA-201$1.2k – $2.0k
10.11Hang doors6 eachmeasuredA-101$1.8k – $3.2k
12.1Wall sheeting62 m²derivedA-101$2.4k – $3.9k
21.1Patch, prepare, paint62 m²derivedA-101$2.6k – $3.8k
Bathroom renovation · worked example$16.4k – $27.3kMeasured quantities and benchmarked rates · GST inclusive+ $1.8k – $4.5k provisional, shown separately
The working seven steps, in order
Line totals
HBCF
Contingency
Subtotal
Margin
Headline
Provisional

Costing · 1 of 2

Taken off the drawing, not guessed.

The difference between an estimate and a takeoff is measurement. BRUCE reads the document set and prices against quantities he derived, not quantities he assumed.

Anything that could not be measured is labelled and carries an allowance instead.

A-2011:50
15.1Wall and floor tiling, wet areasmeasured
14.1Waterproofing, floor and upstandsmeasured
10.11Hang doorsmeasured
12.1Wall sheetingderived
21.1Patch, prepare, paintderived
Takeoff bathroom and laundry · document set
RefItemQtyBasisSheetRange
15.1Wall and floor tiling, wet areas31 m²measuredA-201$6.8k – $11.4k
14.1Waterproofing, floor and upstands9 m²measuredA-201$1.2k – $2.0k
10.11Hang doors6 eachmeasuredA-101$1.8k – $3.2k
12.1Wall sheeting62 m²derivedA-101$2.4k – $3.9k
21.1Patch, prepare, paint62 m²derivedA-101$2.6k – $3.8k
Costing · 2 of 2

The model measures. The code decides.

Every sum, cap and total is computed the same way, in the same order, every time. Two runs of the same project produce the same number.

Provisional sums sit beneath the headline with their trigger. They are never folded in.

Bathroom renovation · worked example$16.4k – $27.3kMeasured quantities and benchmarked rates · GST inclusive+ $1.8k – $4.5k provisional, shown separately
The working seven steps, in order
Line totals
HBCF
Contingency
Subtotal
Margin
Headline
Provisional

E.Engine
Engine · 1 of 3

The part that decides what not to say.

A layer of fixed checks sits between what the model proposes and what the report prints. Each one was written after a specific failure, and records the failure it exists to prevent.

Engine · 2 of 3

More evidence, tighter range.

A budget alone returns a wide range. Add ideas and photos and it narrows. Add your documents and it narrows again. Every report states how much was measured, every time.

Engine · 3 of 3

Every returned quote sharpens the next estimate.

A library built from public sources is where the band starts. A builder's quote for that work, at that address, that month, is what moves it. Each one is an observation.

Quotes you accept tune the estimates on your own account, and the line says when it was priced from your accepted work.

Price what is there.

Reject what cannot be true.

Never manufacture what is missing.

Checks proposed line → report
A budget+ ideas and photos+ your documents
$160k$240k$320k
$180k – $300kLow confidence
Evidence and range same kitchen, three stages
What you bringMeasuredMeasured · assumedRangeLabel
A budget18%
$180k – $300kLow
+ ideas and photos46%
$205k – $265kMedium
+ your documents72%
$225.3k – $245.8kHigh
Printed always, not only when the share is good. Showing it only when it flatters would make its absence a claim.
Q1
Q2
Q3
Q4
Q5
$6.8k$11.4k
Tiling · line 15.1 · Lane Cove
Prior → posterior tiling · line 15.1 · five observations
Prior band$6.8k – $11.4kWidth $4.6k · from sourced rates
Posterior band$7.6k – $10.4kWidth $2.8k · centre +$0.4k
Q5 · $11.2kOutside the posterior. Kept as an observation, not discarded.
The band never closes to a pointA renovation priced to the dollar before a builder has seen it would be a claim, not an estimate.
Engine · 1 of 3

The part that decides what not to say.

A layer of fixed checks sits between what the model proposes and what the report prints. Each one was written after a specific failure, and records the failure it exists to prevent.

Price what is there.

Reject what cannot be true.

Never manufacture what is missing.

Checks proposed line → report
Engine · 2 of 3

More evidence, tighter range.

A budget alone returns a wide range. Add ideas and photos and it narrows. Add your documents and it narrows again. Every report states how much was measured, every time.

A budget+ ideas and photos+ your documents
$160k$240k$320k
$180k – $300kLow confidence
Evidence and range same kitchen, three stages
What you bringMeasuredMeasured · assumedRangeLabel
A budget18%
$180k – $300kLow
+ ideas and photos46%
$205k – $265kMedium
+ your documents72%
$225.3k – $245.8kHigh
Printed always, not only when the share is good. Showing it only when it flatters would make its absence a claim.
Engine · 3 of 3

Every returned quote sharpens the next estimate.

A library built from public sources is where the band starts. A builder's quote for that work, at that address, that month, is what moves it. Each one is an observation.

Quotes you accept tune the estimates on your own account, and the line says when it was priced from your accepted work.

Q1
Q2
Q3
Q4
Q5
$6.8k$11.4k
Tiling · line 15.1 · Lane Cove
Prior → posterior tiling · line 15.1 · five observations
Prior band$6.8k – $11.4kWidth $4.6k · from sourced rates
Posterior band$7.6k – $10.4kWidth $2.8k · centre +$0.4k
Q5 · $11.2kOutside the posterior. Kept as an observation, not discarded.
The band never closes to a pointA renovation priced to the dollar before a builder has seen it would be a claim, not an estimate.
The bar

What we hold the engine to.

Every figure printed with its basis: measured or assumed, benchmarked or estimated.

A measured share above half on a full document set.

No impossible quantity ever displayed.

Every unmeasured line labelled.

Run the engine on your project.

Takeoff, rate bands, arithmetic and provisional sums, with the working printed beside every figure.

A first pass, not an approval. Councils, certifiers and planners decide what gets built, and builders price the work. BRUCE makes sure everyone starts from the same measured scope.